Project Details
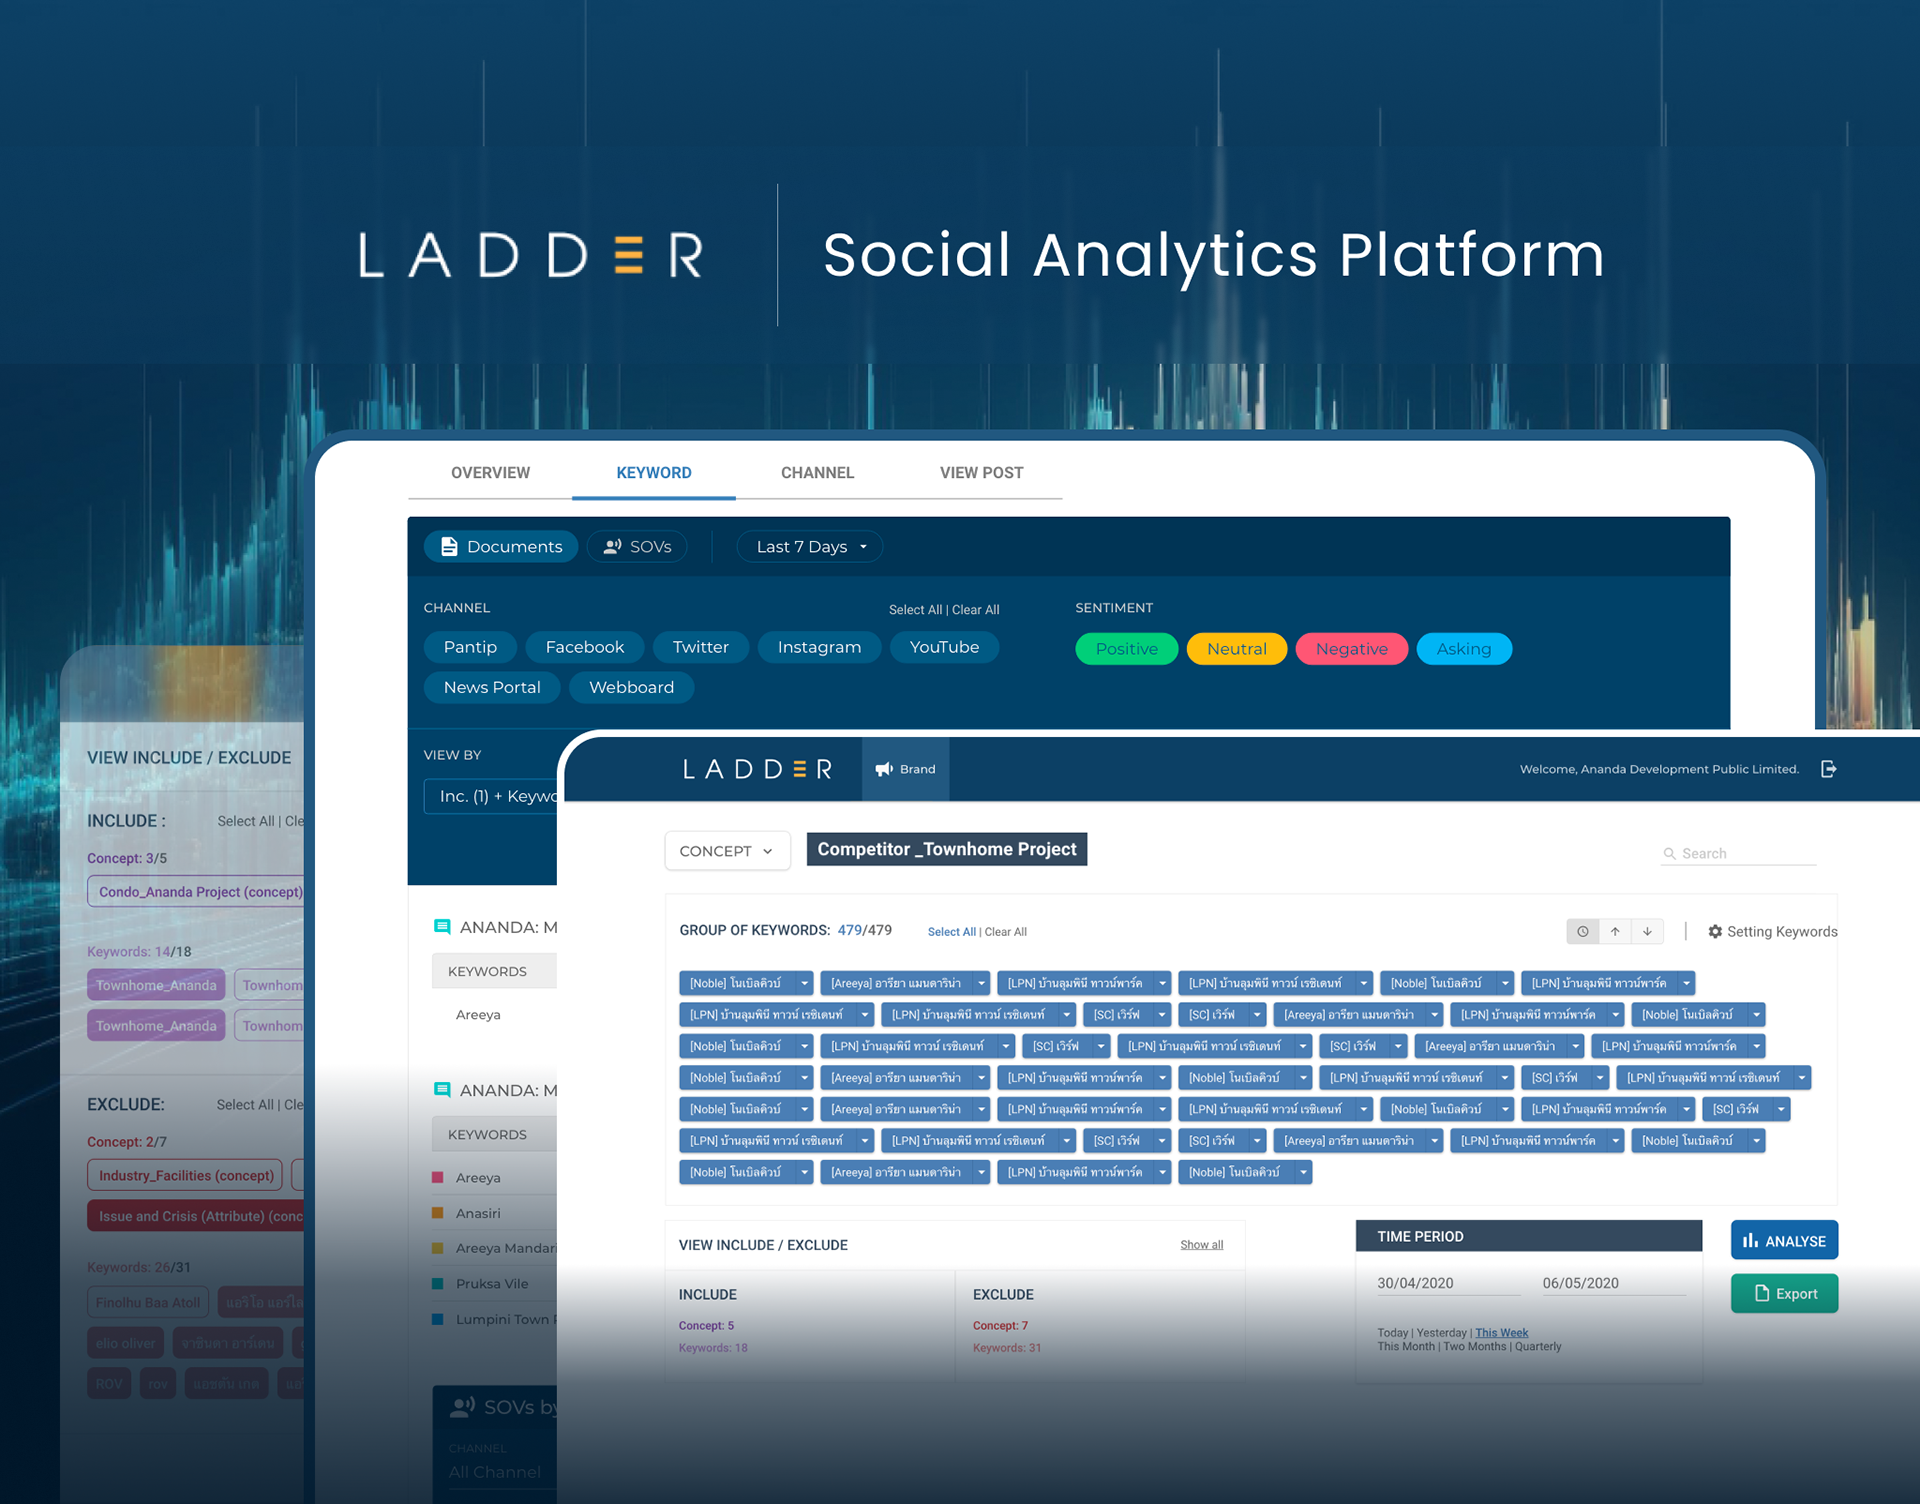
Project: LADDER: Social Analytics Platform
My Role: UX/UI Designer (Data Visualization)
Platform: Web-based Analytics SaaS
Key Focus: Social Data Visualization, Predictive Analytics UX, Strategic Decision Intelligence
My Role: UX/UI Designer (Data Visualization)
Platform: Web-based Analytics SaaS
Key Focus: Social Data Visualization, Predictive Analytics UX, Strategic Decision Intelligence
Overview
— Challenge: To design a high-performance analytics platform that enables brands to decode complex social media engagement data into clear, actionable business strategies.
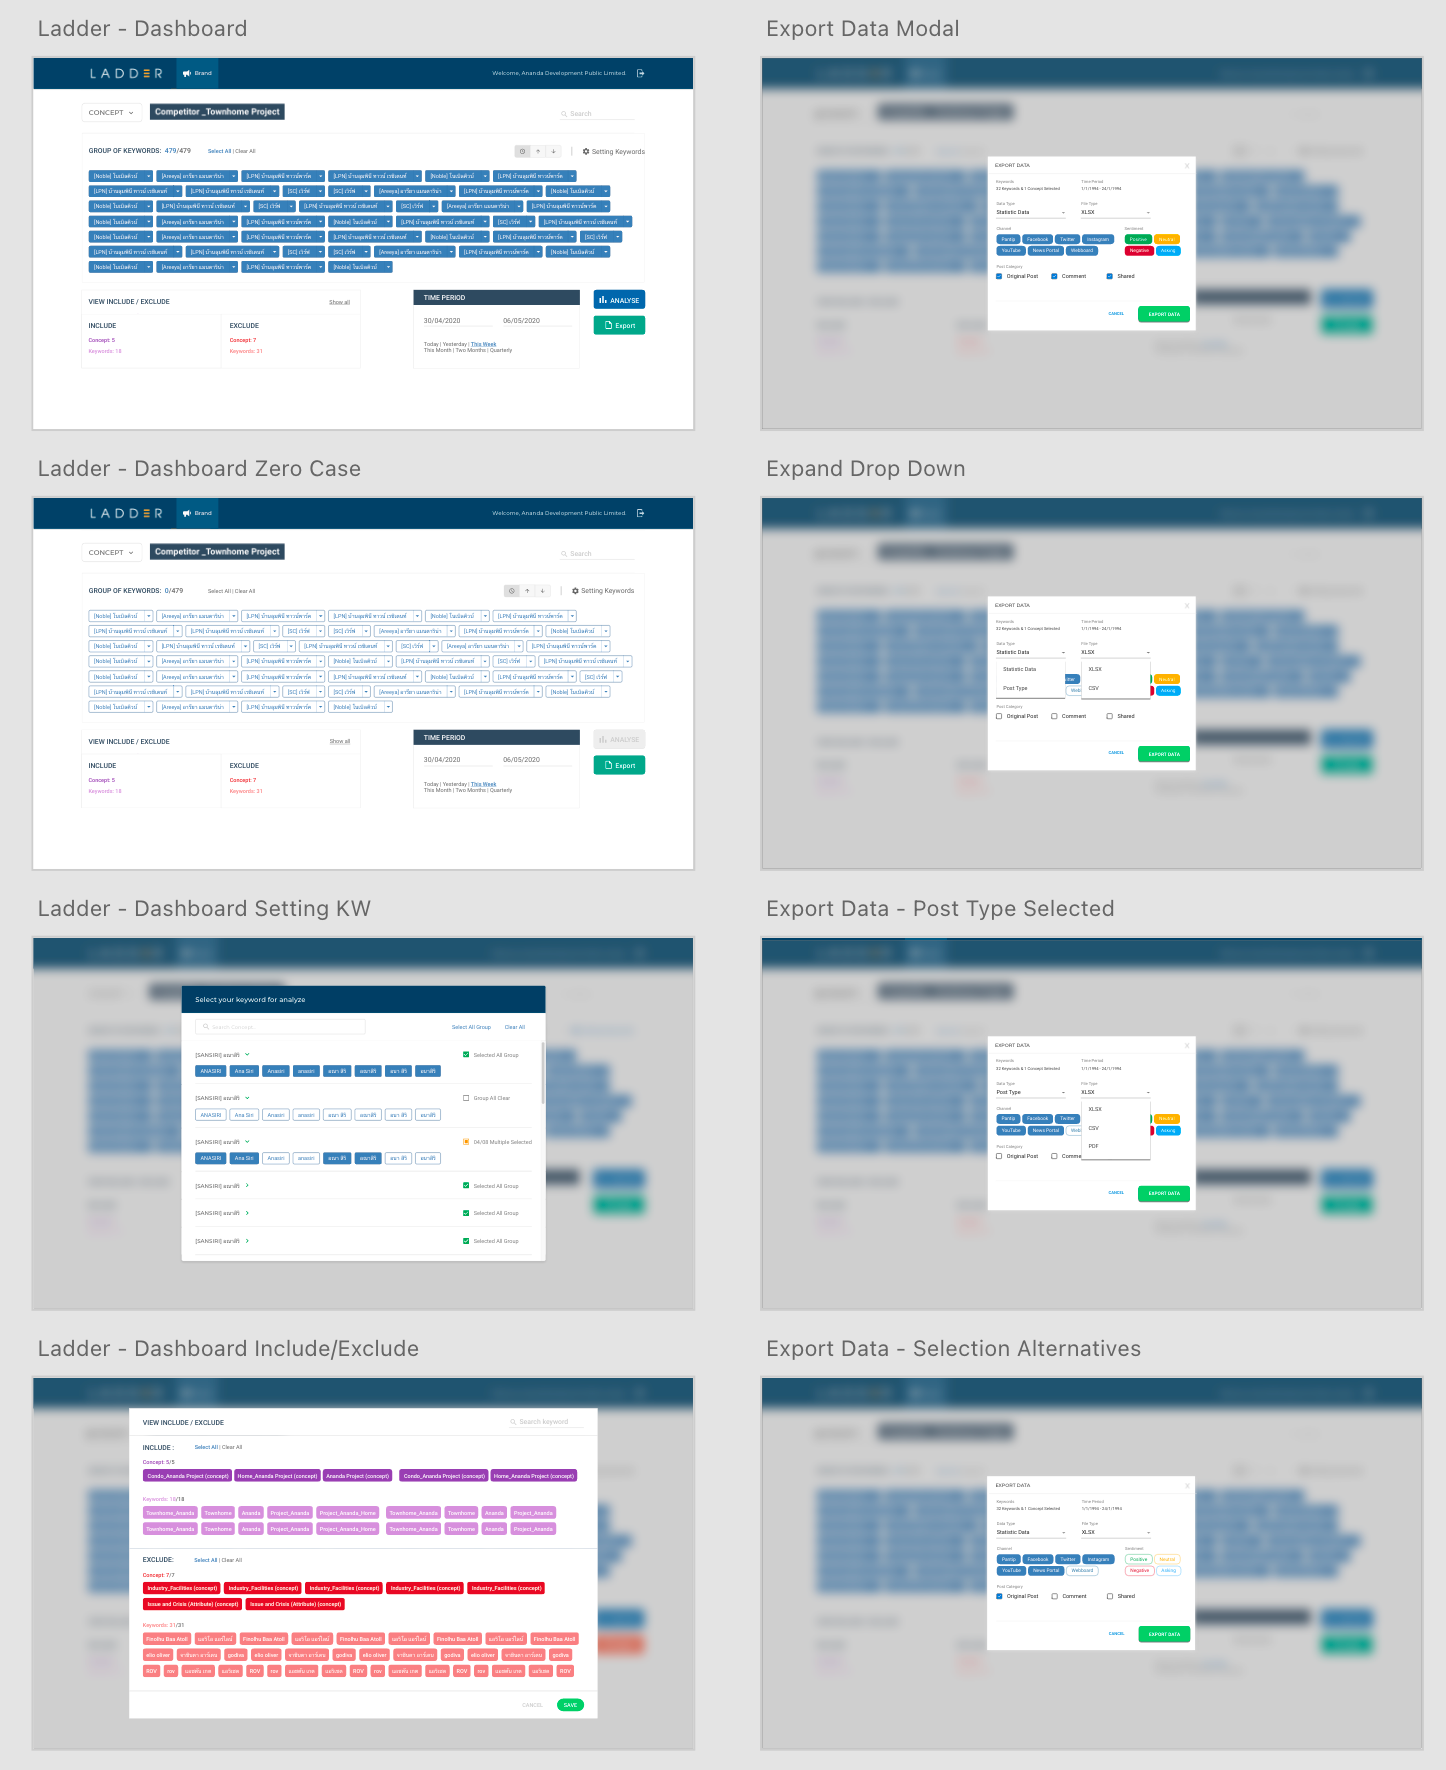
— Solution: Architected a sophisticated, intuitive dashboard that leverages data visualization to simplify social sentiment and trend analysis, allowing stakeholders to identify growth opportunities in real-time.
— Solution: Architected a sophisticated, intuitive dashboard that leverages data visualization to simplify social sentiment and trend analysis, allowing stakeholders to identify growth opportunities in real-time.
Case Study Highlights
1. The Challenge: Social media managers and strategists are often overwhelmed by "data noise." The core challenge was to design a platform that not only displays data but also guides users toward meaningful insights without a steep learning curve.
2. The Process (The Strategy):
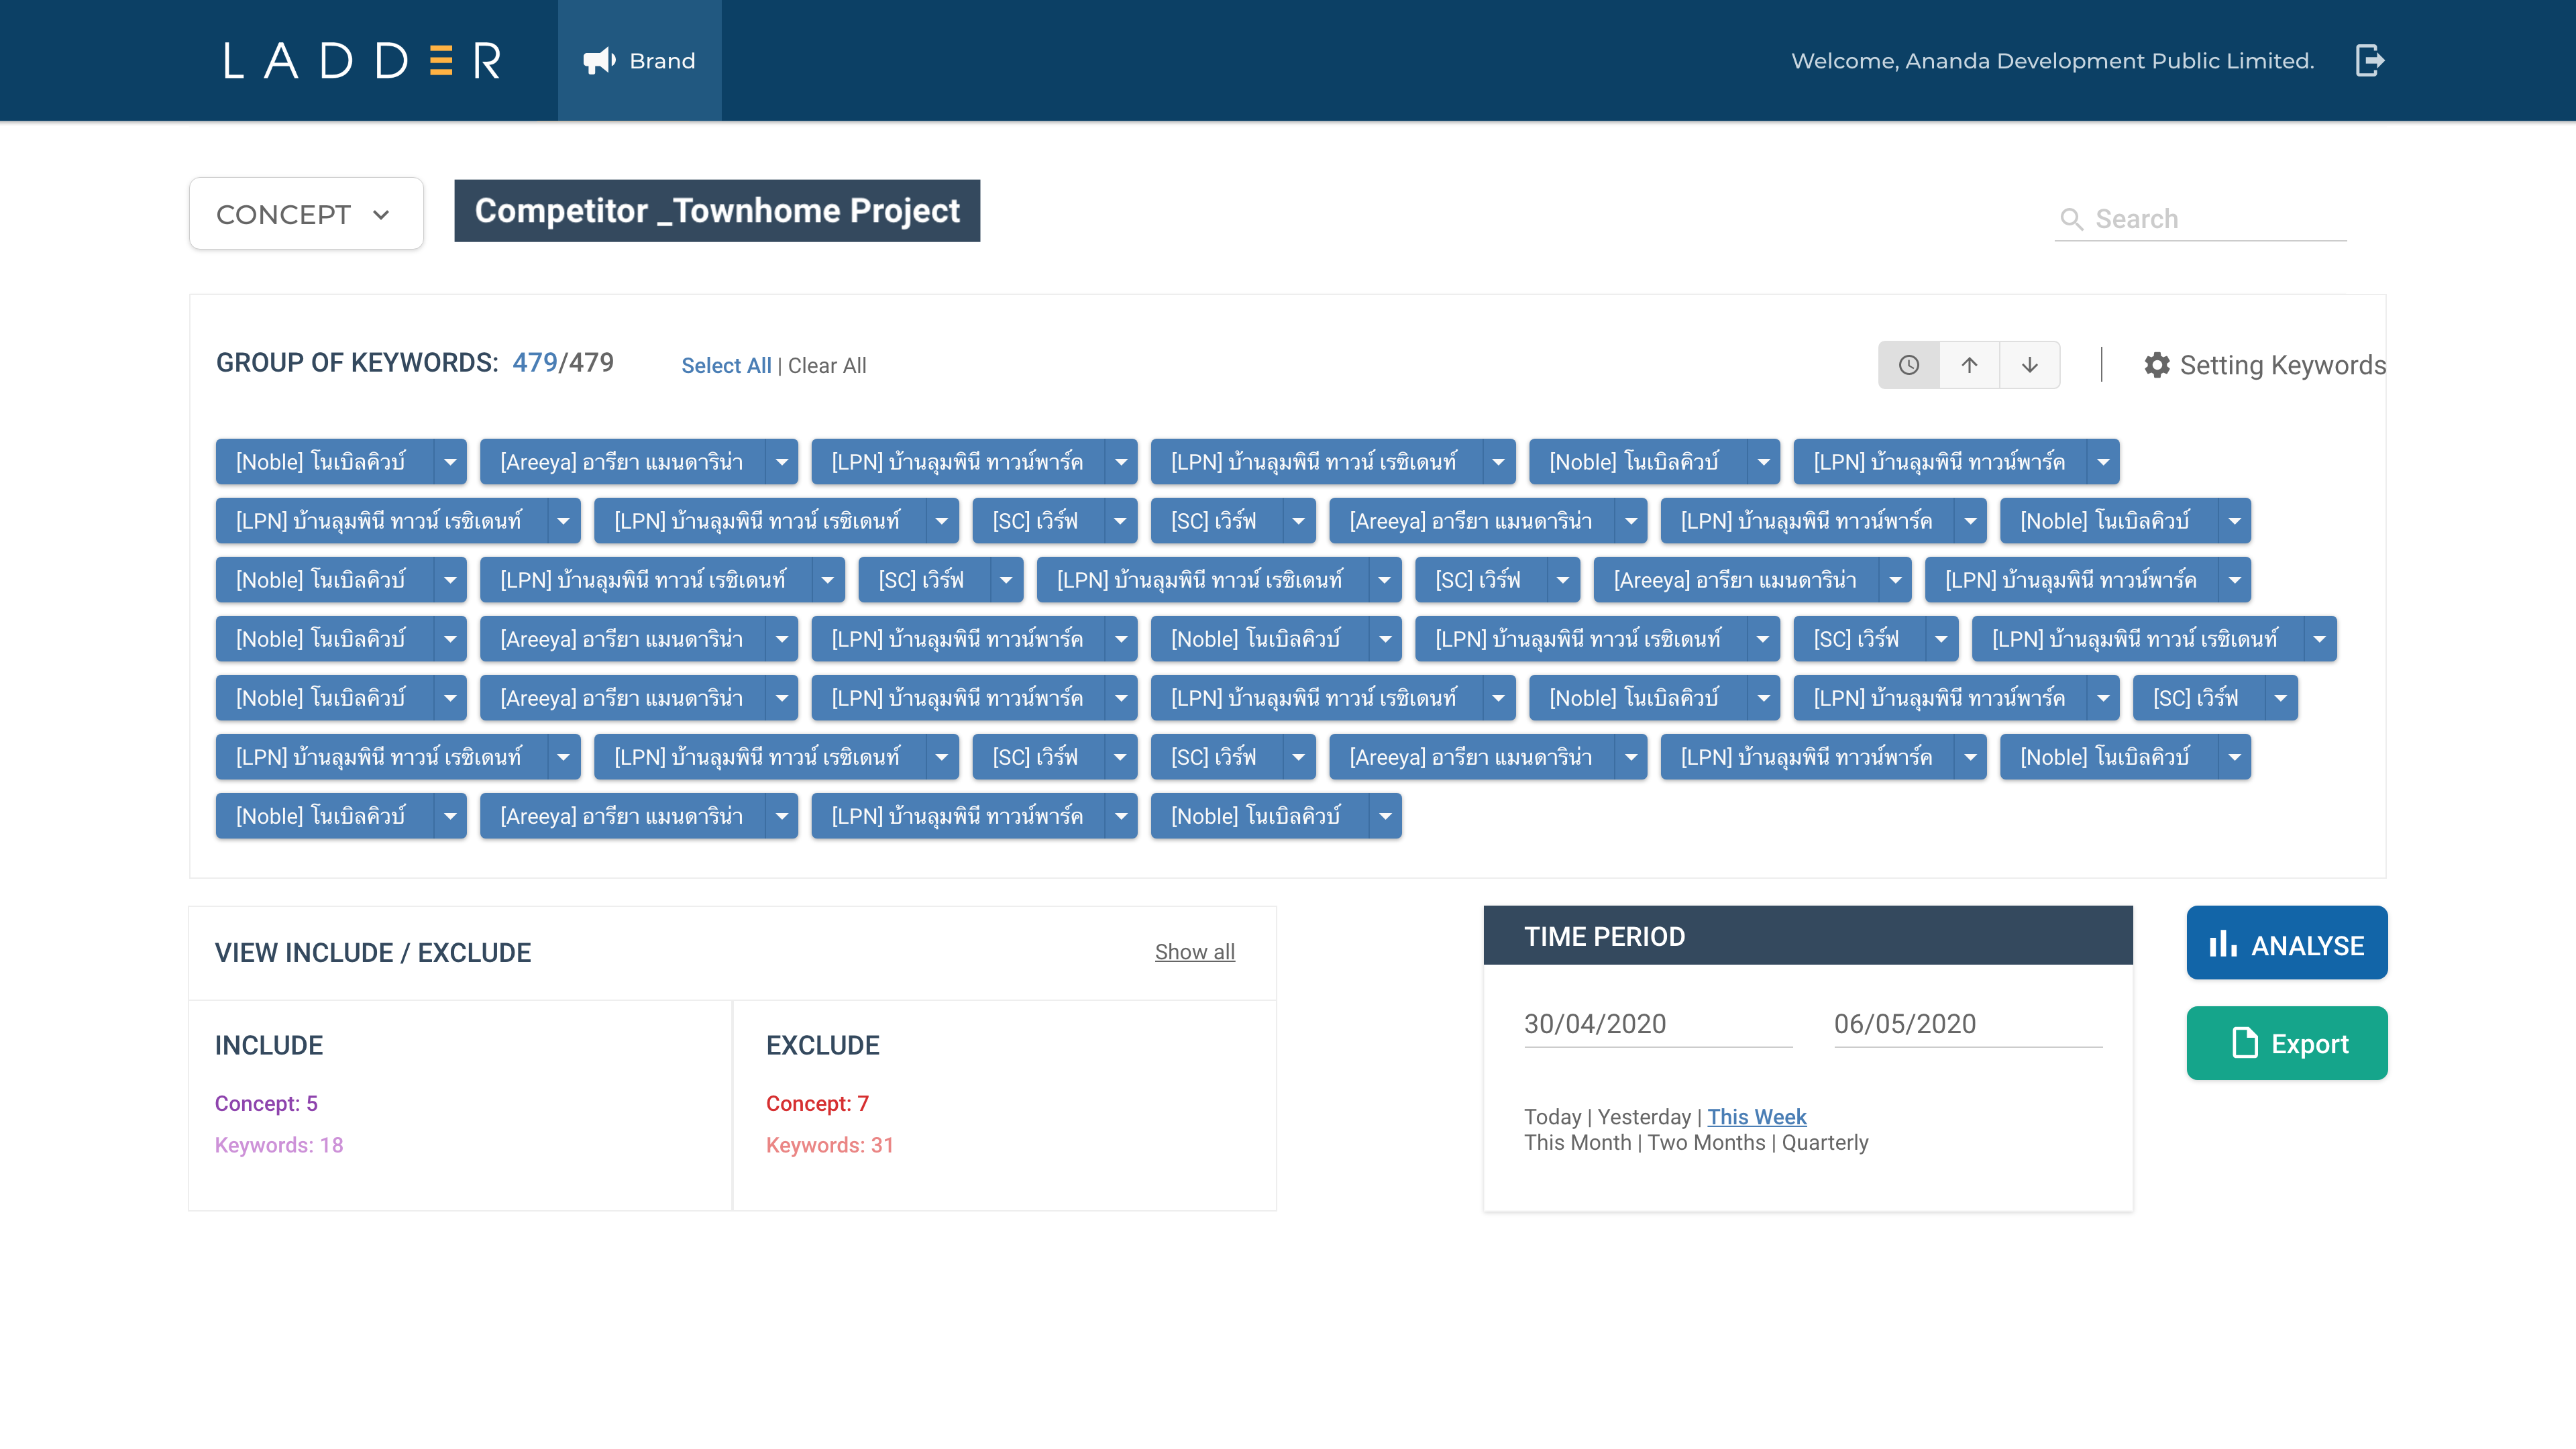
— Data Storytelling & IA: Developed a hierarchy of data presentation, ensuring high-level metrics (KPIs) are immediately visible while allowing users to deep-dive into granular sentiment and demographic trends.
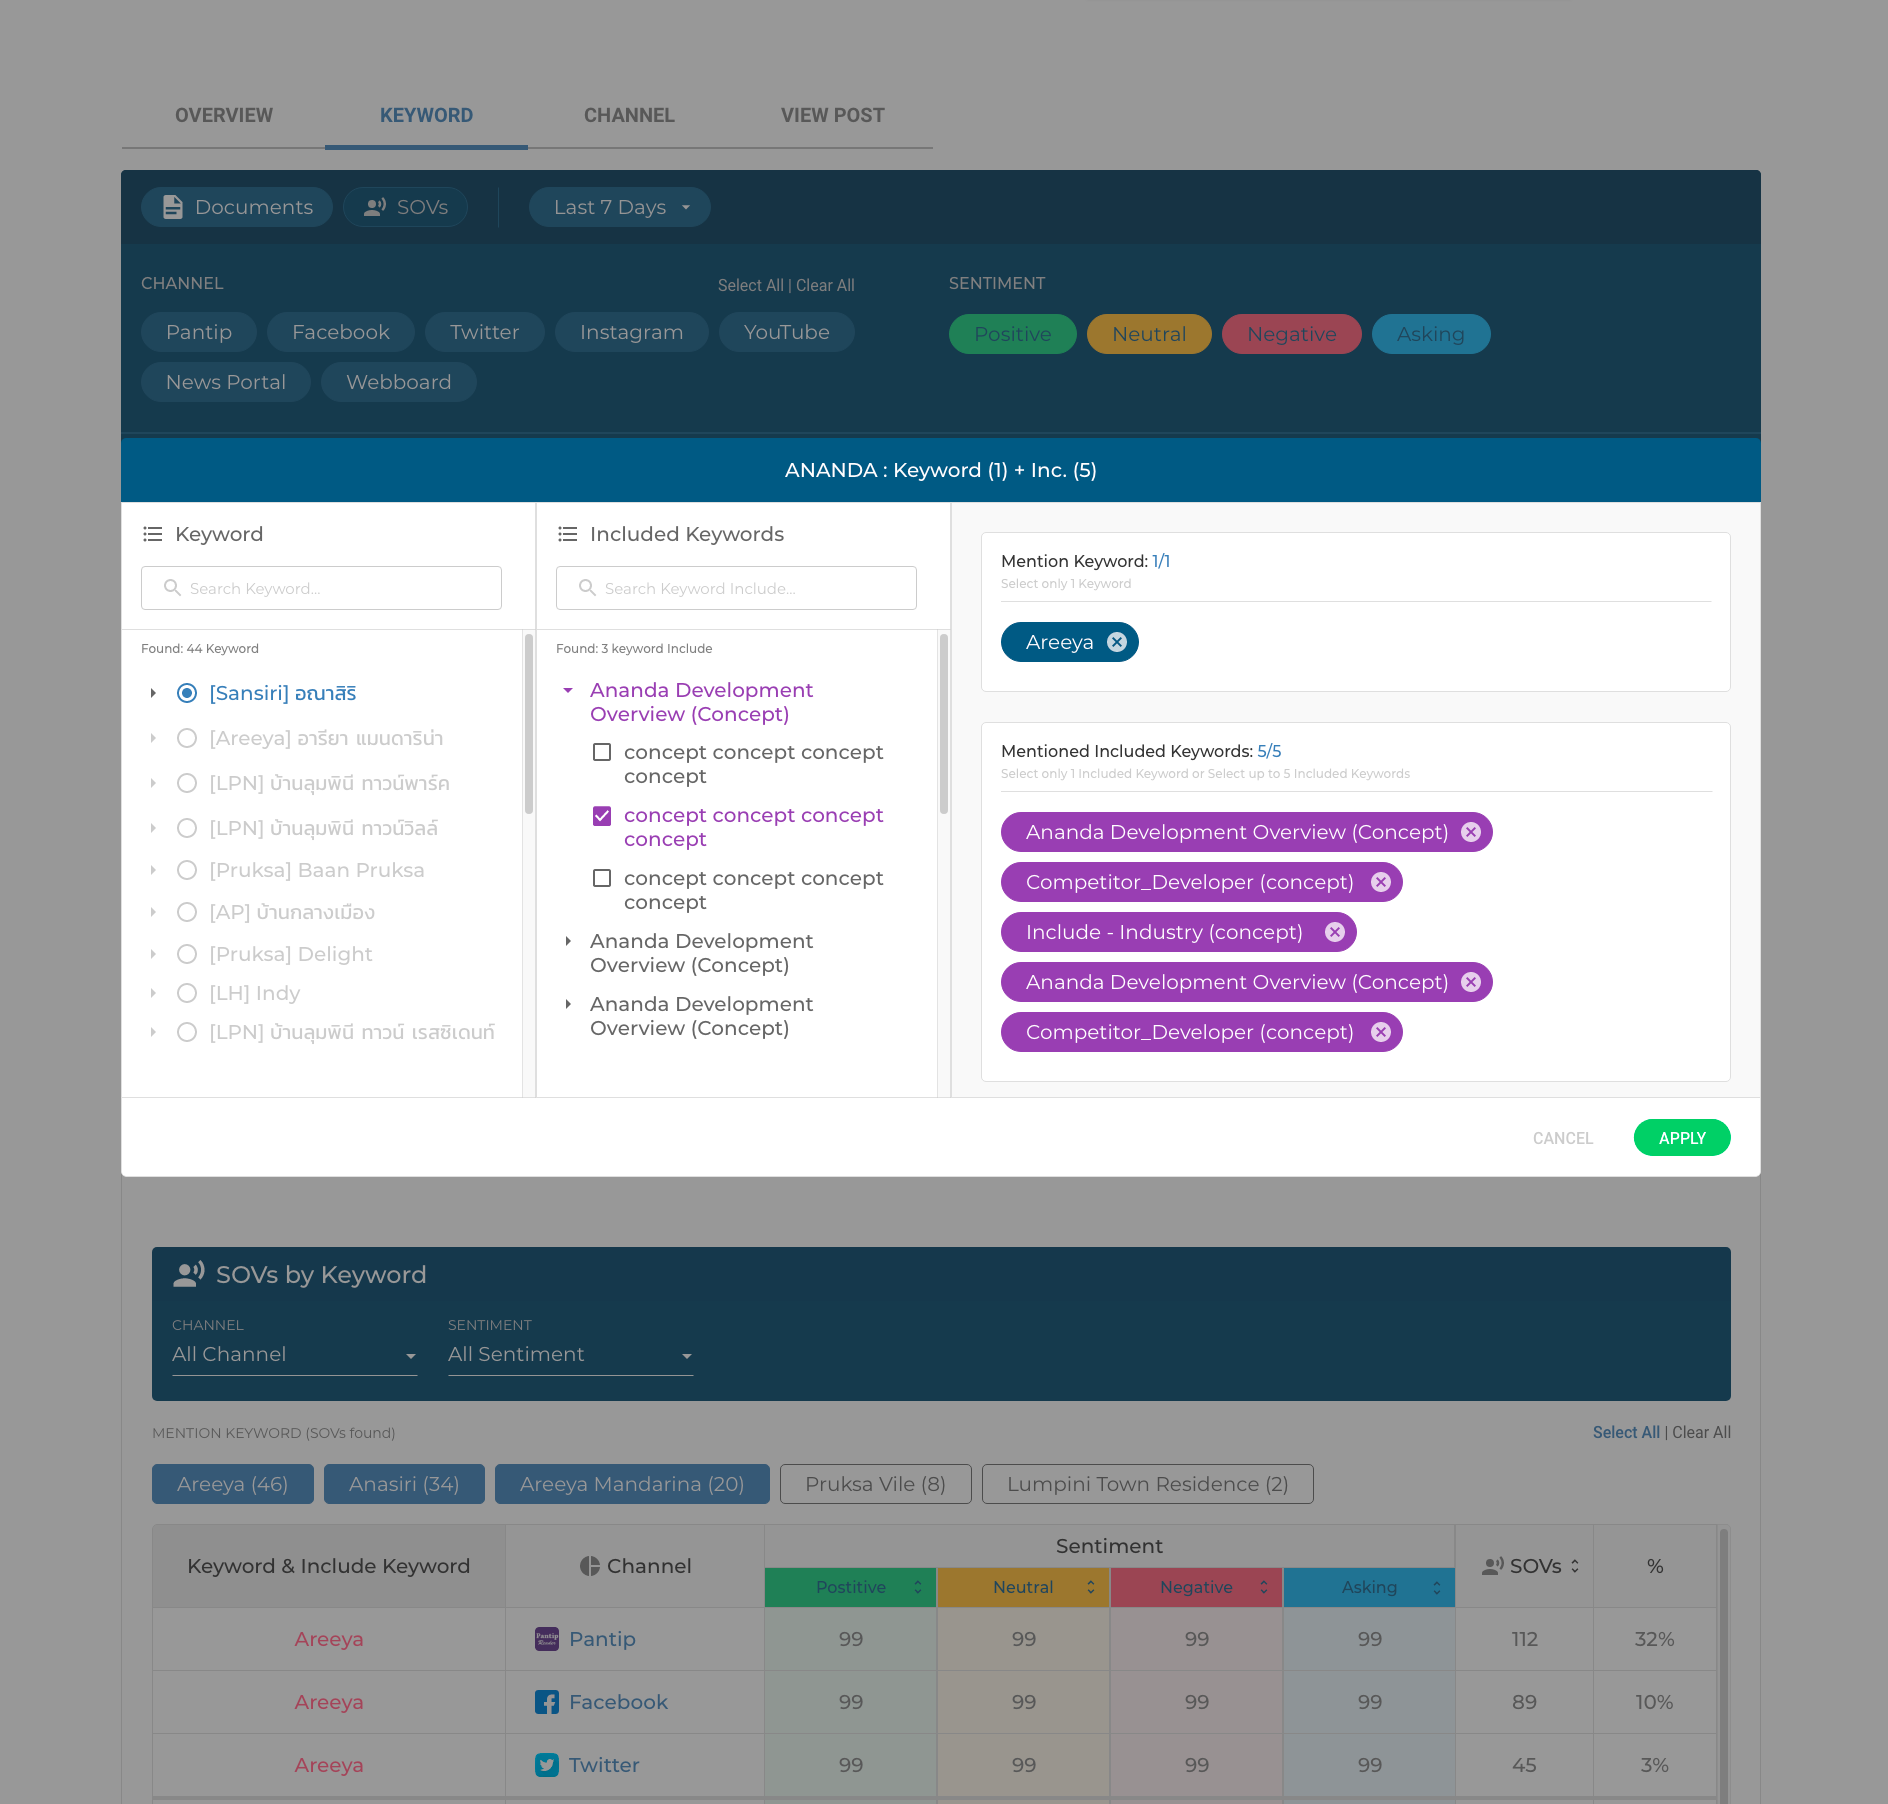
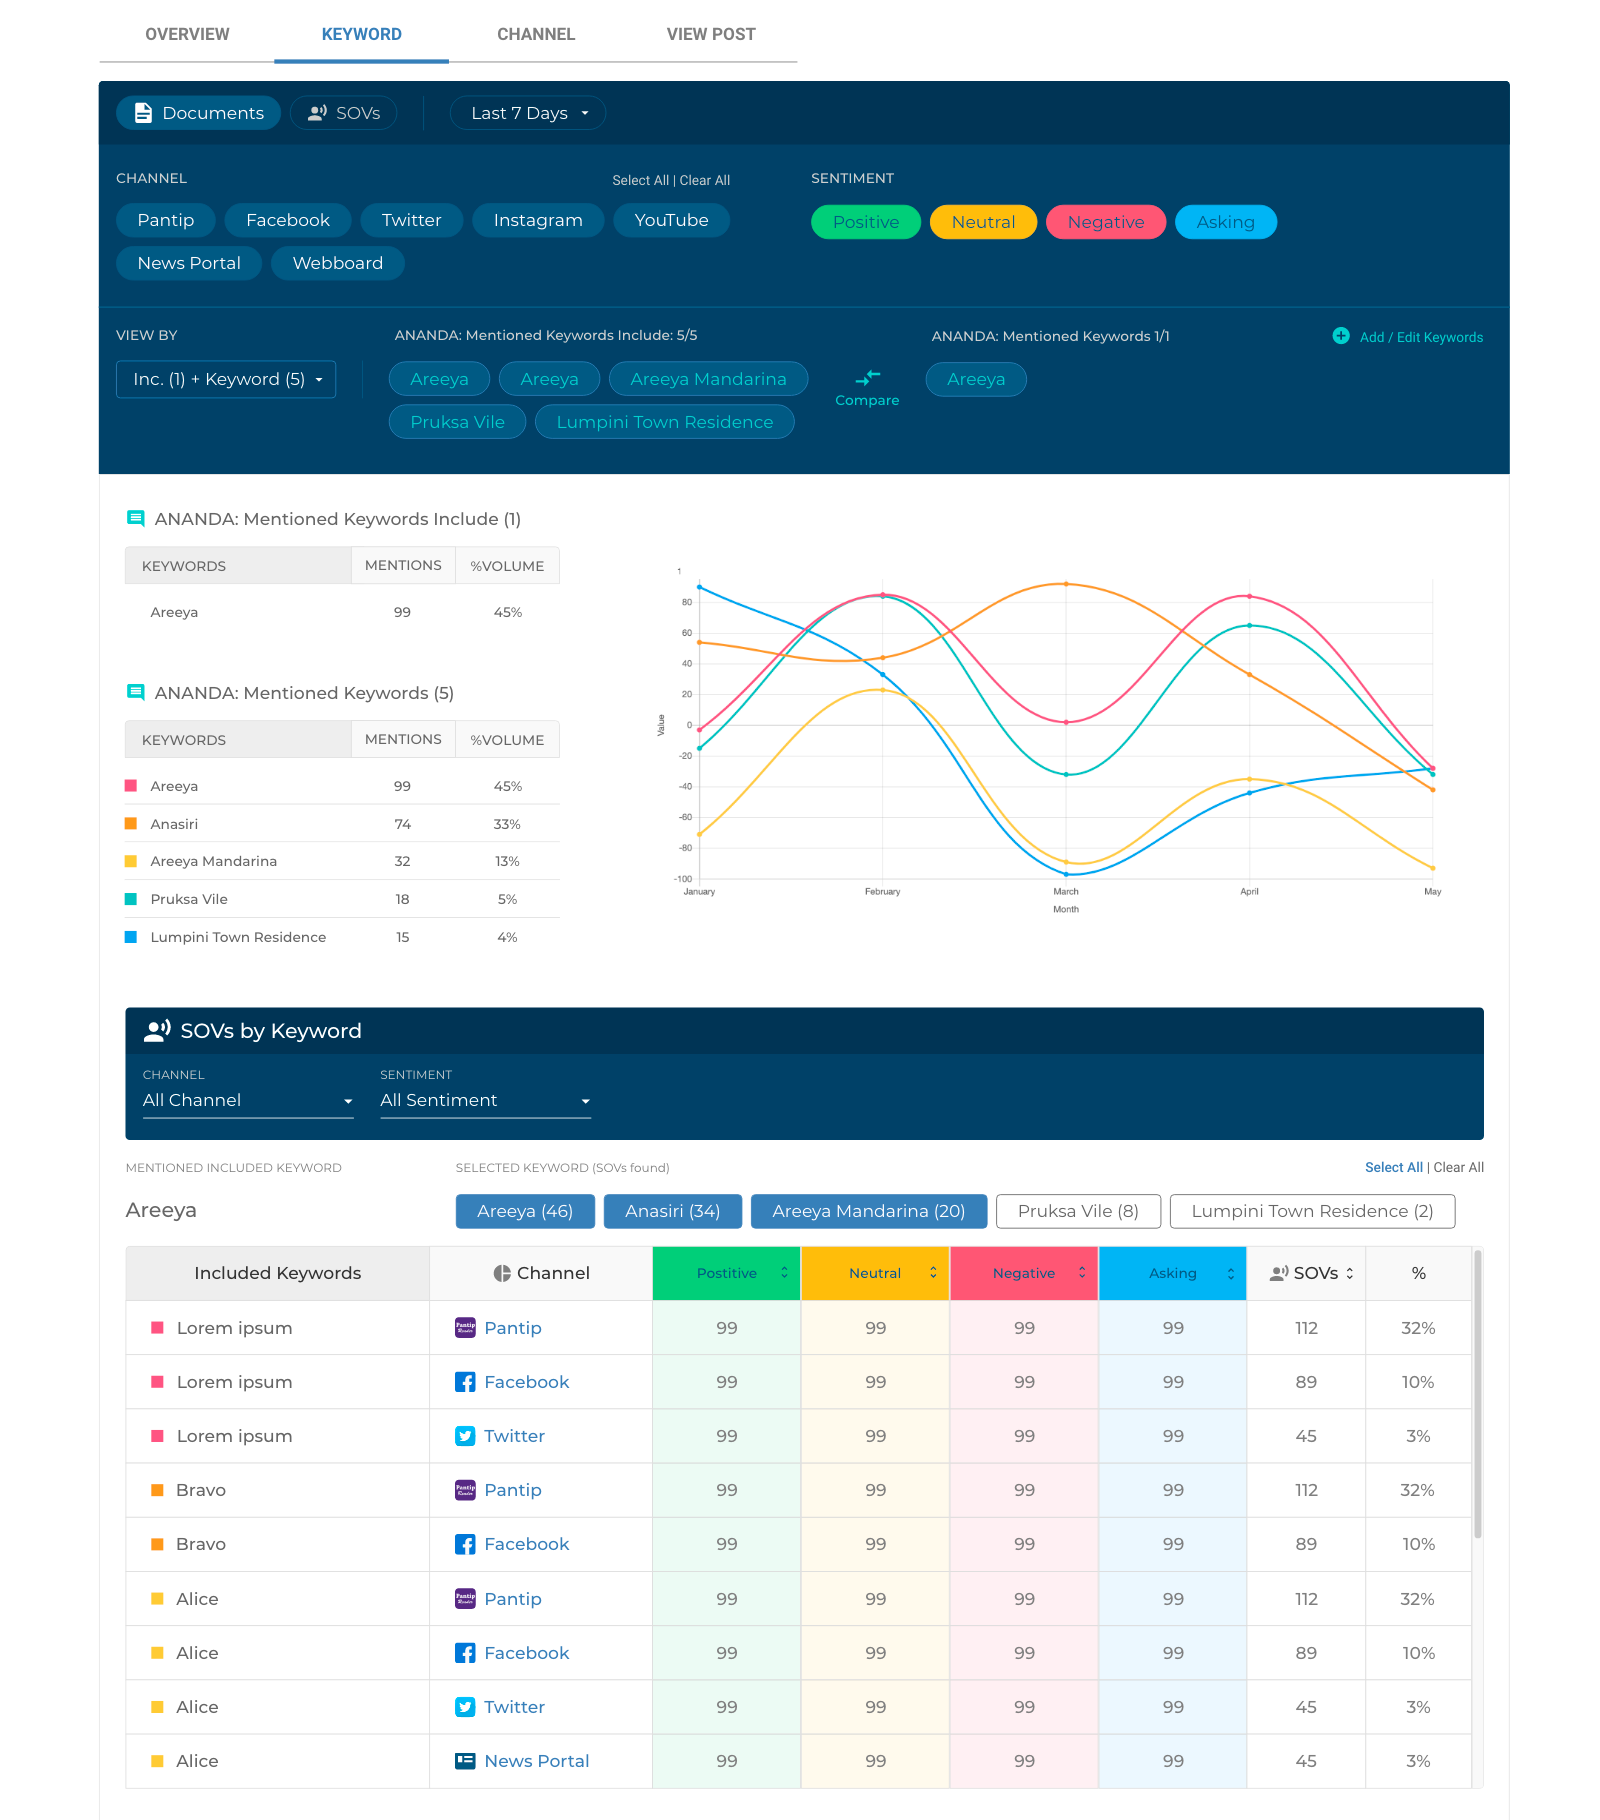
— Adaptive Visualization: Selected specific charting patterns that best represent real-time social dynamics, ensuring that trend lines, heatmaps, and sentiment distributions are easy to compare and interpret.
— User-Centric Complexity Management: Applied progressive disclosure principles, revealing complex filters and advanced features only when needed, maintaining a clean and focused workspace.
— Data Storytelling & IA: Developed a hierarchy of data presentation, ensuring high-level metrics (KPIs) are immediately visible while allowing users to deep-dive into granular sentiment and demographic trends.
— Adaptive Visualization: Selected specific charting patterns that best represent real-time social dynamics, ensuring that trend lines, heatmaps, and sentiment distributions are easy to compare and interpret.
— User-Centric Complexity Management: Applied progressive disclosure principles, revealing complex filters and advanced features only when needed, maintaining a clean and focused workspace.
3. The Solution & Impact:
— Actionable Intelligence: Empowered users to move beyond raw metrics to data-informed content strategies, directly improving campaign performance.
— Operational Clarity: Reduced the time required to perform social audits by providing an all-in-one centralized platform.
— Intuitive Design: Successfully democratized complex analytics, making professional-grade data tools accessible to marketers without a data science background.