Project Details
Client: CSN Research Ltd. (for Honda Thailand)
Agency: Backyard Co., Ltd
My Role: UX/UI & Data Architecture
Timeline: 12 Weeks (Phase 1–3: Strategy to Deployment)
Platform: Enterprise Web-based BI Dashboard
Key Focus: Data Visualization, Enterprise UX, Decision
Agency: Backyard Co., Ltd
My Role: UX/UI & Data Architecture
Timeline: 12 Weeks (Phase 1–3: Strategy to Deployment)
Platform: Enterprise Web-based BI Dashboard
Key Focus: Data Visualization, Enterprise UX, Decision
Overview
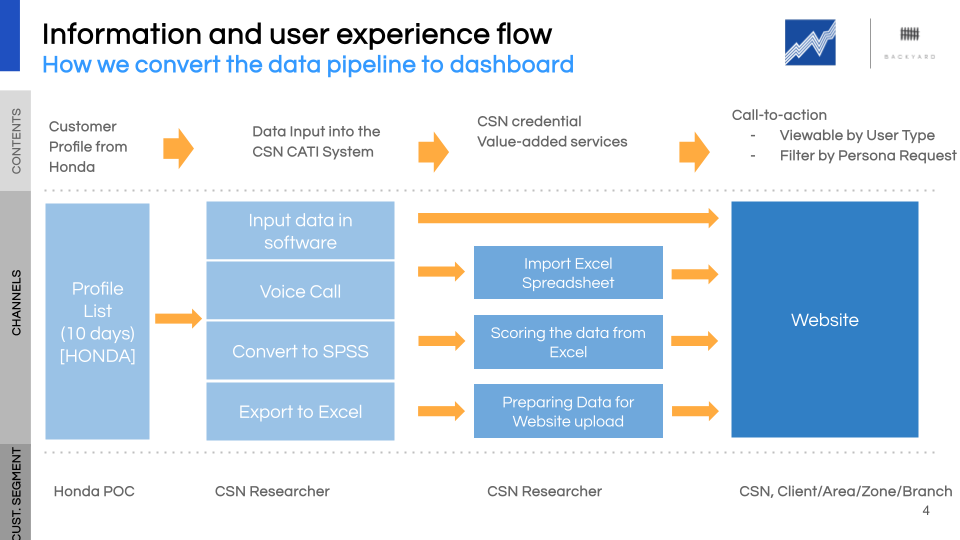
Challenge: Honda faced significant delays in strategic decision-making due to fragmented Customer Satisfaction (CSI) data across nationwide dealerships and reliance on manual, error-prone spreadsheet reporting.
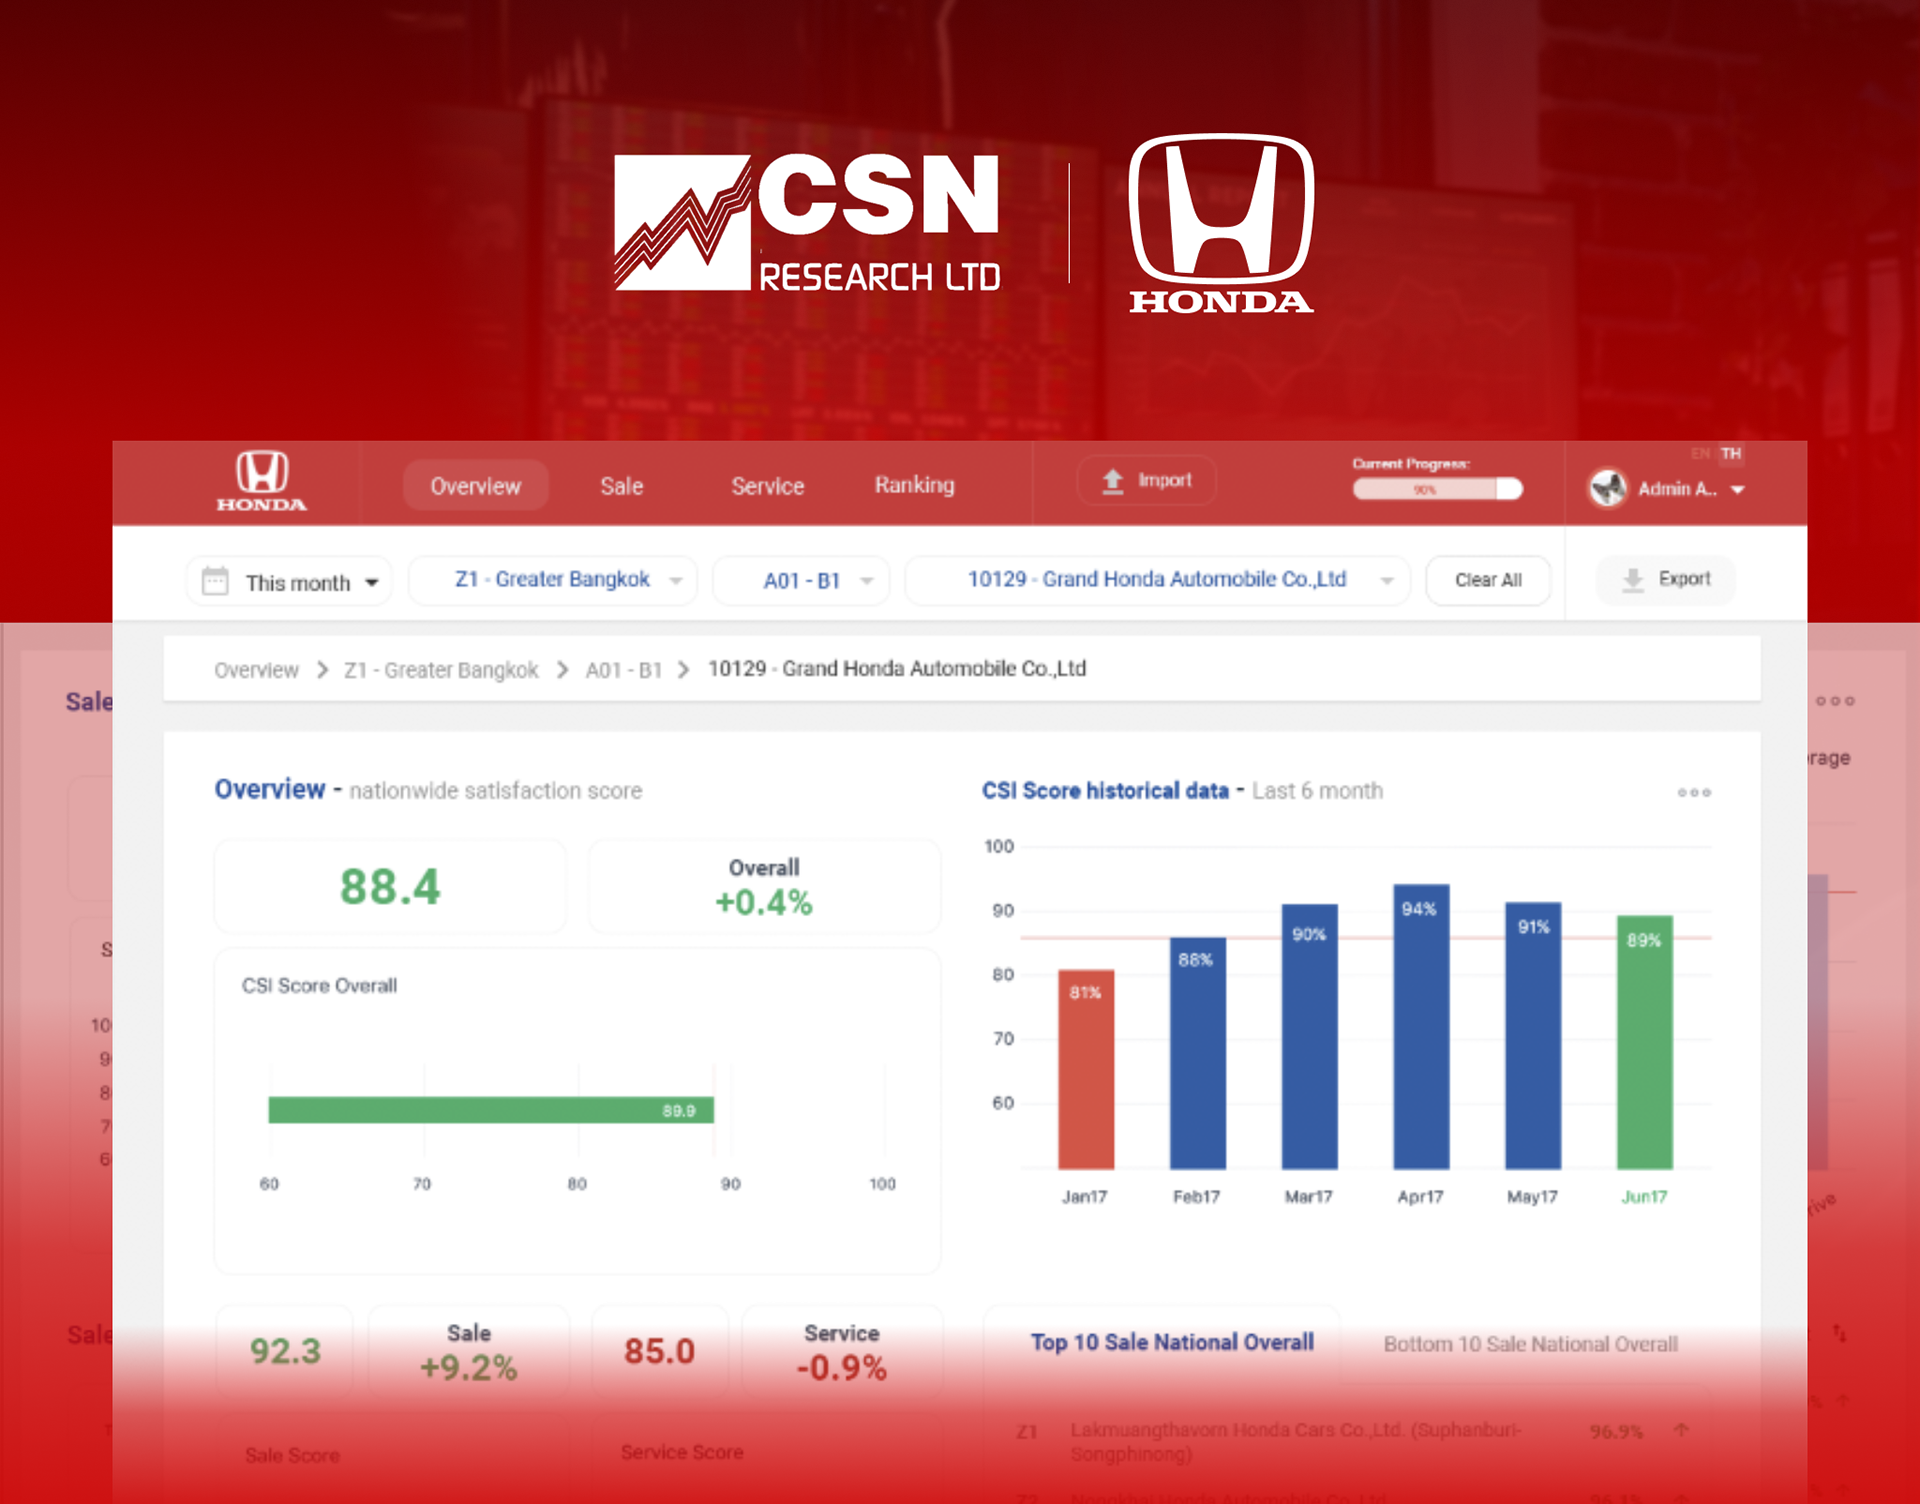
Solution: Architected a real-time Business Intelligence (BI) dashboard that transforms complex raw data into intuitive, actionable visual insights, empowering executive leadership to drive data-informed strategies.
Solution: Architected a real-time Business Intelligence (BI) dashboard that transforms complex raw data into intuitive, actionable visual insights, empowering executive leadership to drive data-informed strategies.
Case Study
The Challenge: Data silos from various systems (CATI/Excel) created visibility gaps, making it impossible for HQ to monitor dealer performance in real-time or identify underperforming branches efficiently.
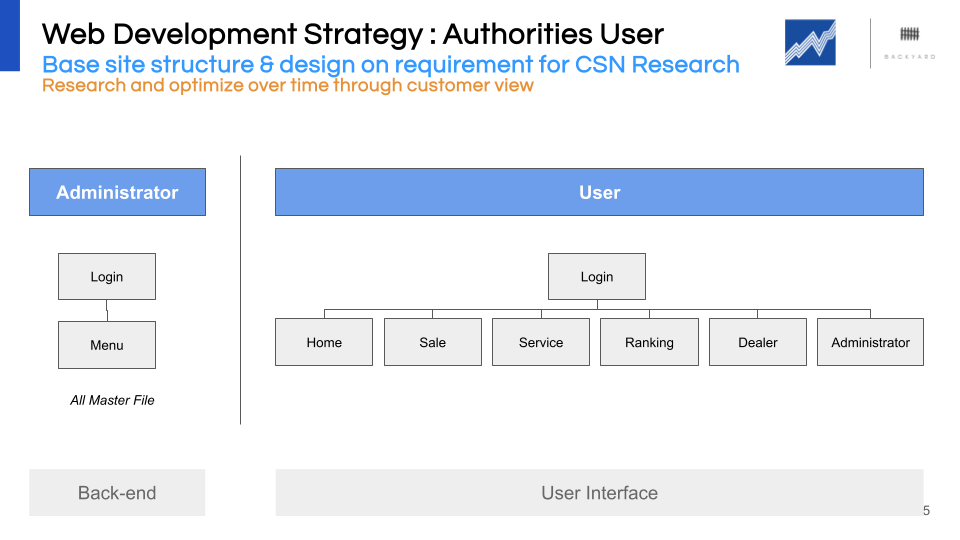
— UX Strategy: Developed a multi-layered filtering system (Client/Area/Branch) to minimize cognitive load, allowing users to drill down from high-level summaries to granular details instantly.
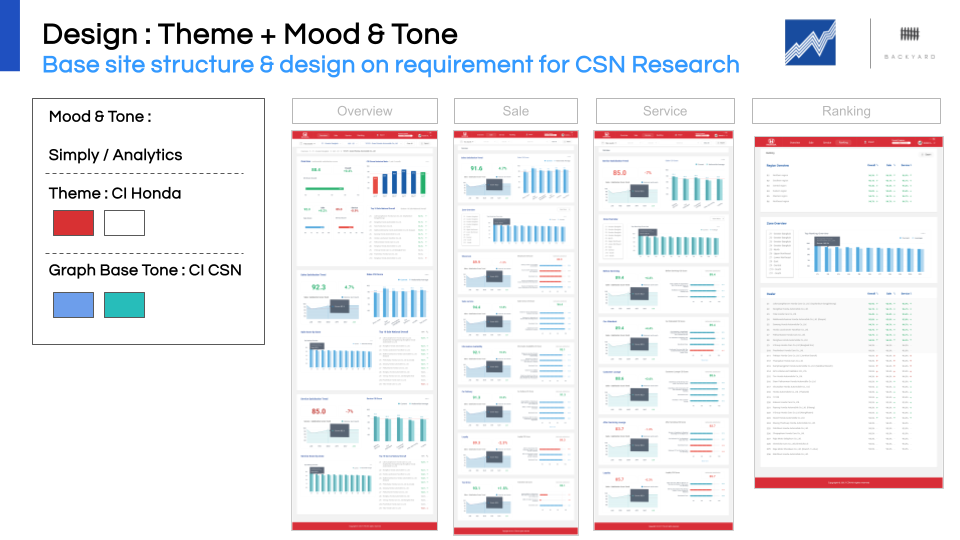
— Design Execution: Applied high-density data visualization principles to ensure KPIs and regional comparisons are clear at a glance.
The Process
Information Architecture (IA): Re-engineered the data pipeline to map complex regional metrics into a clean, hierarchical structure.— UX Strategy: Developed a multi-layered filtering system (Client/Area/Branch) to minimize cognitive load, allowing users to drill down from high-level summaries to granular details instantly.
— Design Execution: Applied high-density data visualization principles to ensure KPIs and regional comparisons are clear at a glance.
The Solution & Impact:
— Efficiency: Automated manual reporting, reducing turnaround time from days to seconds.
Strategic Growth: Provided HQ with real-time visibility to reward top-tier dealerships and support underperforming branches proactively.
— Scalability: Created a flexible, automated system that sets a new benchmark for performance monitoring in the automotive retail sector.
asdasdasd